

GA4 shows you what happened Traffic Analytics shows you why
Traffic Analytics merges your GA4 and Google Search Console data into one dashboard, with 93 metrics, 7 acquisition channels broken down by quality, and two classic analytics metrics, Bounce Rate and Exit Rate, brought back.
7-day free trial · No credit card required
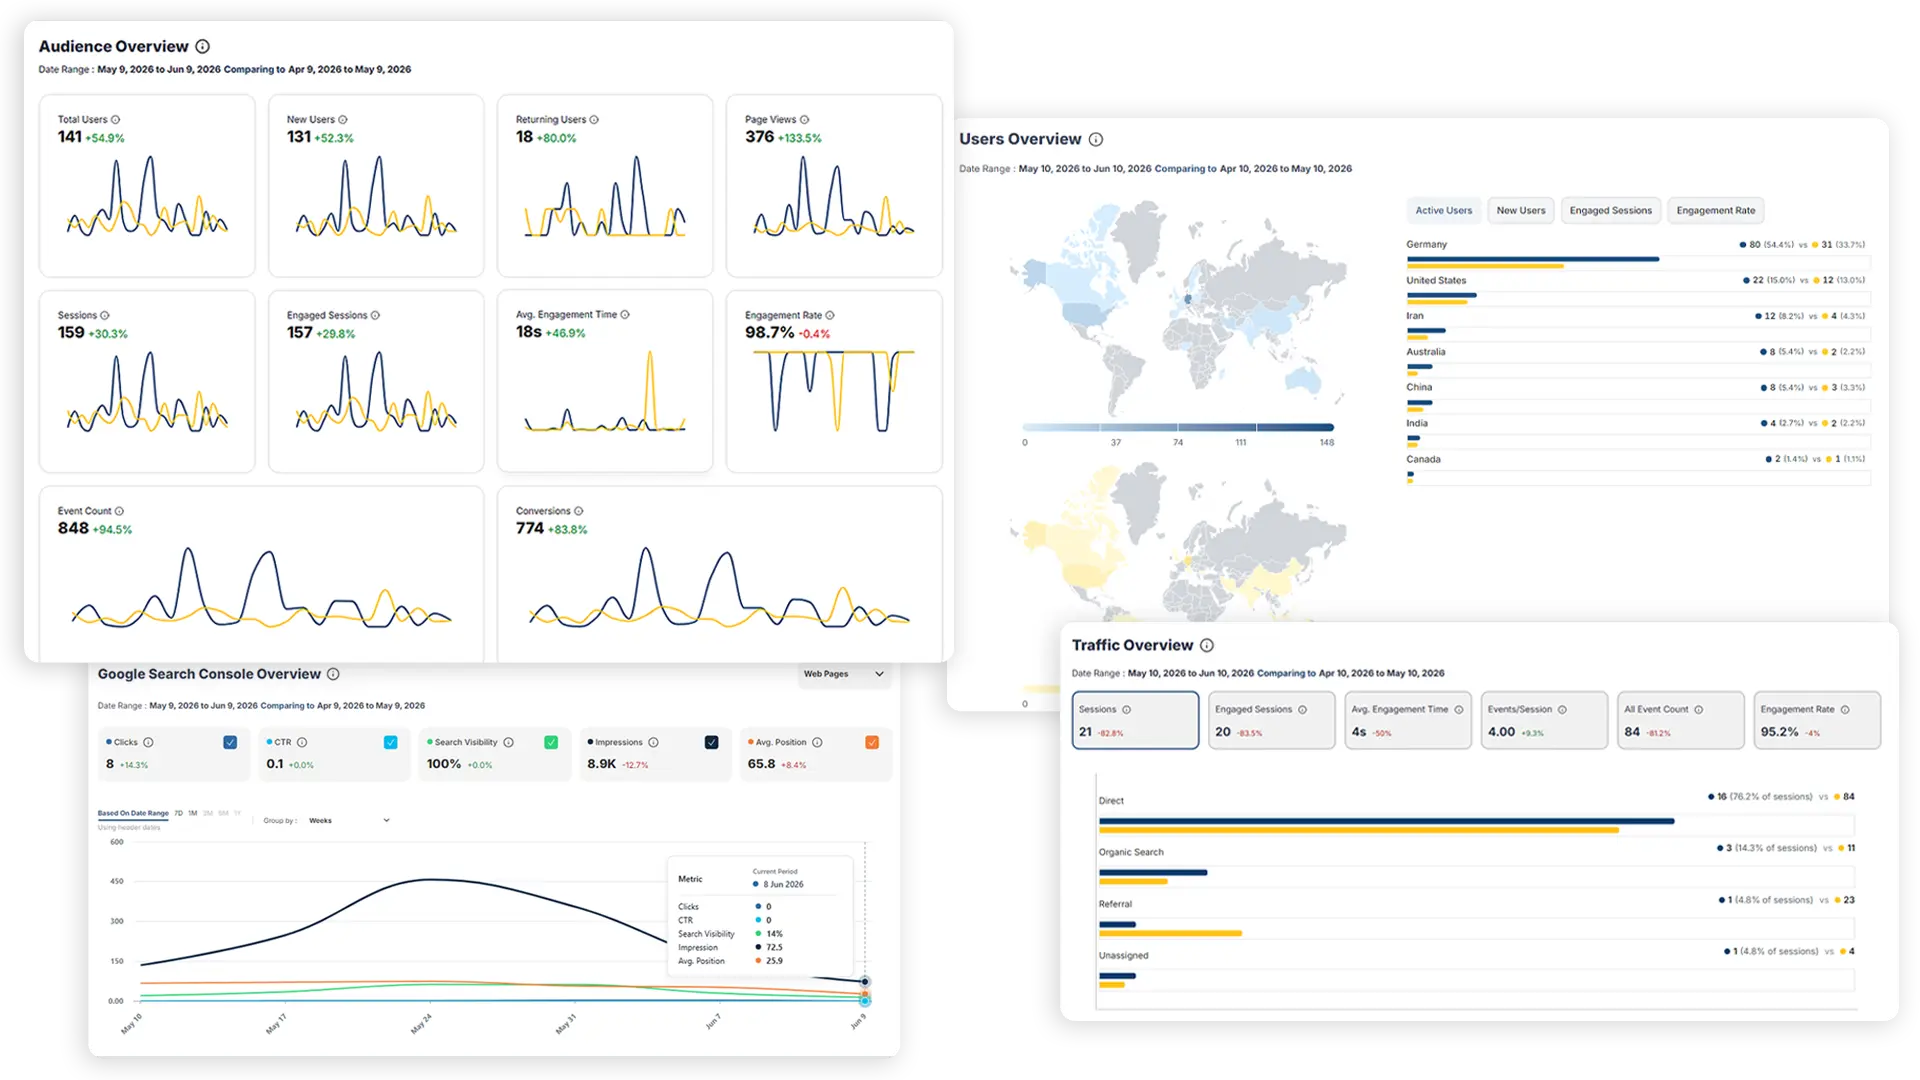
You open GA4 on Monday morning and traffic is down Now what?
GA4 shows you the number changed. It won't tell you which channel caused it, whether the drop is in engagement or just volume, or what your organic search visibility looks like versus the previous month. Answering that in GA4 alone means custom Explore reports and 45 minutes you don't have.
You see the drop but can't explain it
GA4 shows traffic declined. It won't break that down by channel quality, engagement rate, or geographic shift, not without building a custom Explore report that takes longer than the answer is worth. If the drop turns out to be technical, a Website Audit can help pinpoint the cause.
Your search data and traffic data live in separate tools
GA4 has your sessions. GSC has your impressions, CTR, and average position. Switching between them every time you need one answer is friction that costs real time every single week.
Two classic metrics, often missing from standard reports
Bounce Rate and Exit Rate aren't part of GA4's default reporting view. If your reporting was built around those metrics, and most teams' was, you've likely been working around that gap.
Channel volume tells you nothing about channel health
Organic might be your top channel by sessions but your worst by engagement rate. You won't know from a traffic bar. You need quality per channel, not just a count.
Connect once Everything answers itself
No manual data pulling. No spreadsheet cross-referencing. Connect your GA4 and Search Console and the full picture assembles automatically, updated daily, ready when you open it.
Connect your GA4 and Search Console
Link your Google accounts in your project settings. Your GA4 behavioural data and your GSC search performance data flow into a single view, the only place they exist together without a custom integration.
Your full traffic picture loads automatically
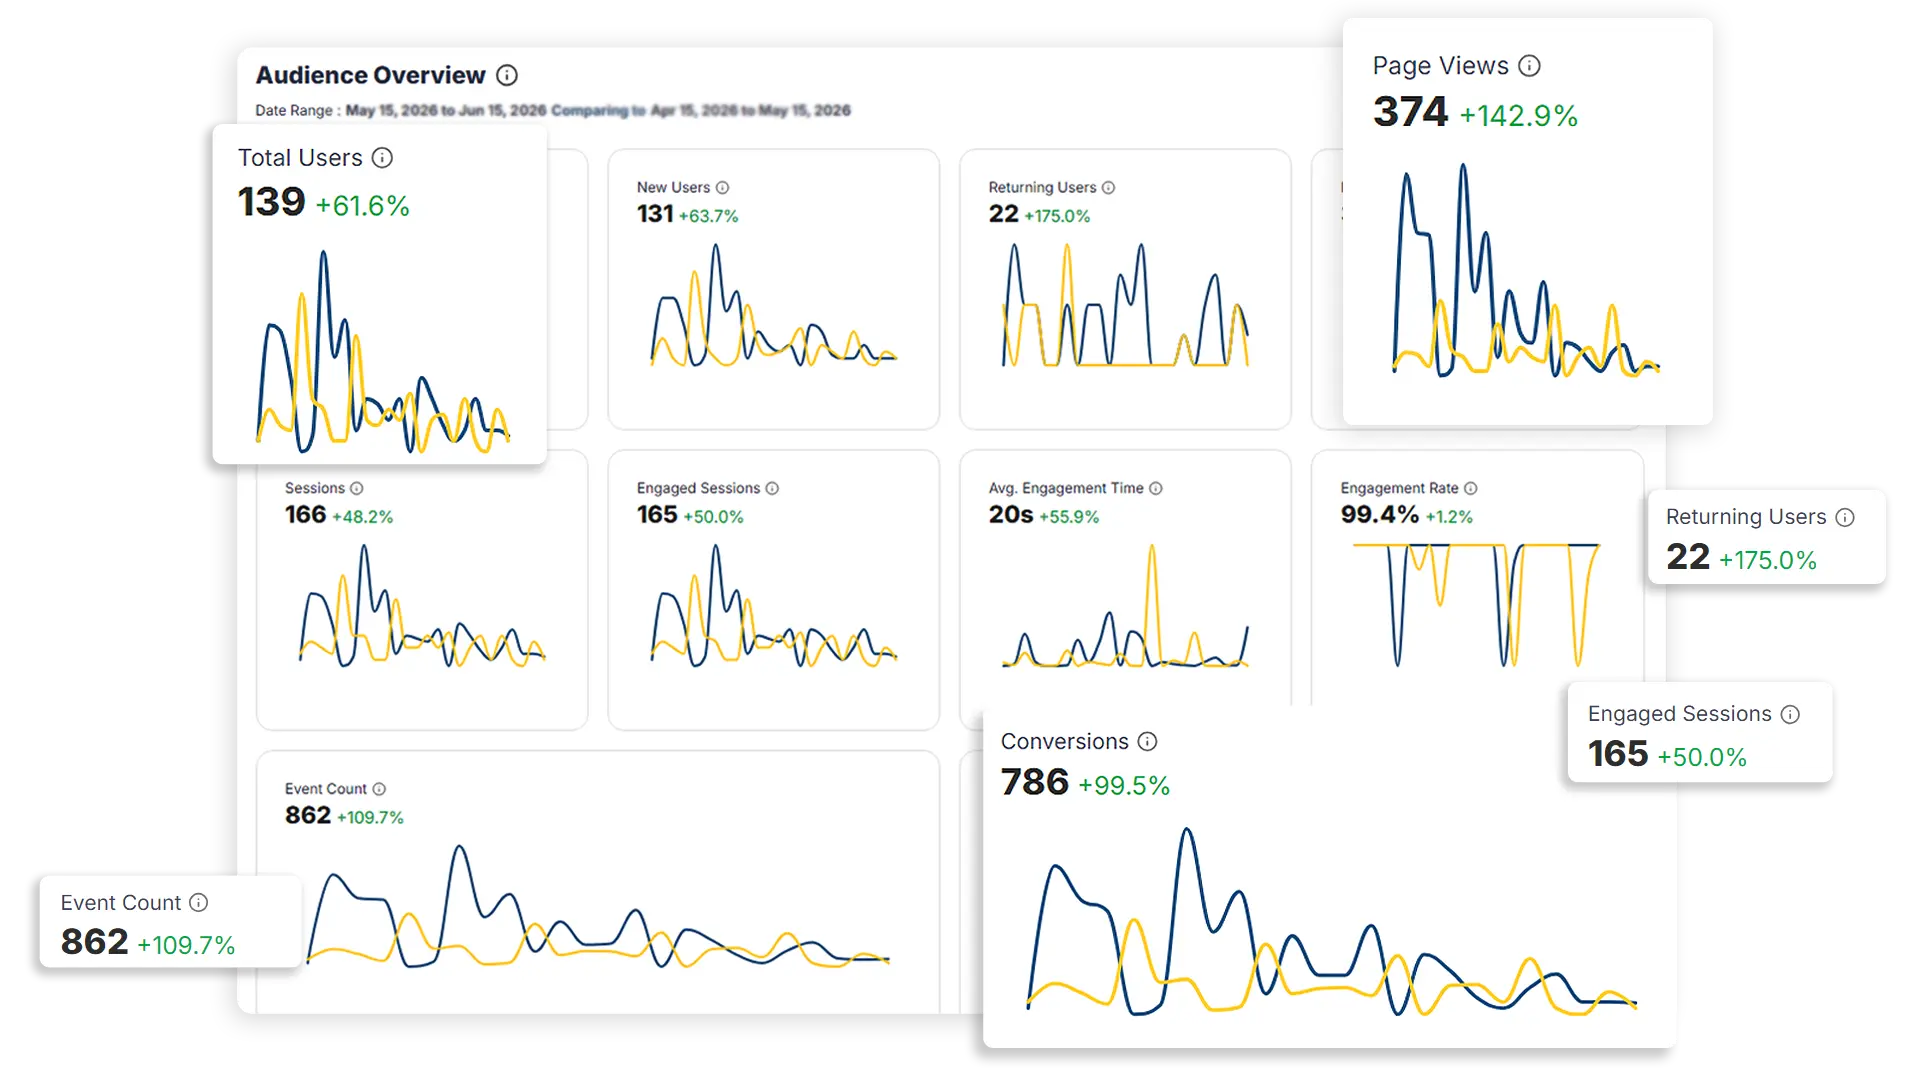
The overview dashboard populates with 10 KPI sparkline cards, a world traffic map, a 7-channel breakdown, and a GSC trend chart, all for your selected date range, all with period-over-period comparison enabled by default.
- Green and red growth deltas on every metric, so you see the direction of travel at a glance
- Set any custom date range: this month vs last month, this quarter vs the same quarter last year
- Switch between Daily, Weekly, Monthly, and Yearly groupings on every chart
Drill into the why across 5 analysis tabs
When a number moves, click into it. Five dedicated tabs let you interrogate traffic by audience, demographics, source, page, and event, each with a multi-line chart and a sortable data table with growth cells on every column.
- Audience Overview: sessions, users, and engagement time trends
- User Demographics: 11 dimensions × 7 engagement metrics per row
- Traffic Sources: 7 channels on a shared line chart, with a source/medium breakdown table
- Pages & Content: active users, engagement time, and event count per URL
- Events & Conversions: event count per active user, ranked by name
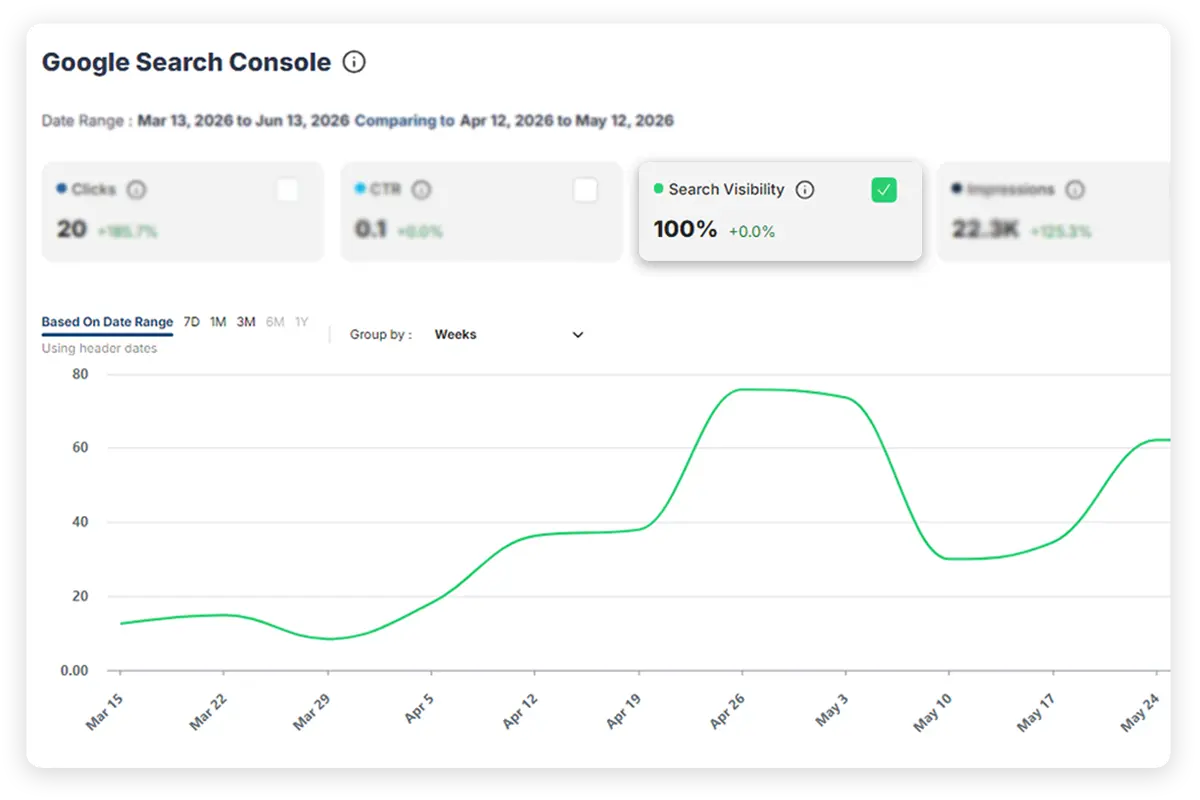
What share of the available search clicks are you actually capturing?
Most analytics tools tell you how many clicks you got. Search Visibility tells you how many you could have got, and what share of the total available organic search opportunity your site is currently taking.
- Weights the search volume of every keyword you rank for by the click-through rate its position typically earns, then expresses the total as a daily 0–100% score
- Does not exist in GA4 alone, GSC alone, or any standard free tool
- A site at 12.4% is capturing roughly 1 in 8 of the clicks available across its rankings, with 87.6% still to gain
Bounce Rate and Exit Rate are here
Many marketers who moved from Universal Analytics to GA4 built years of reporting around Bounce Rate and Exit Rate. Those metrics aren't part of GA4's standard reports today, so if your reporting relied on them, that's a gap you've probably been working around. They're here, per page, per country, per device, and per query, with period-over-period growth on every row.
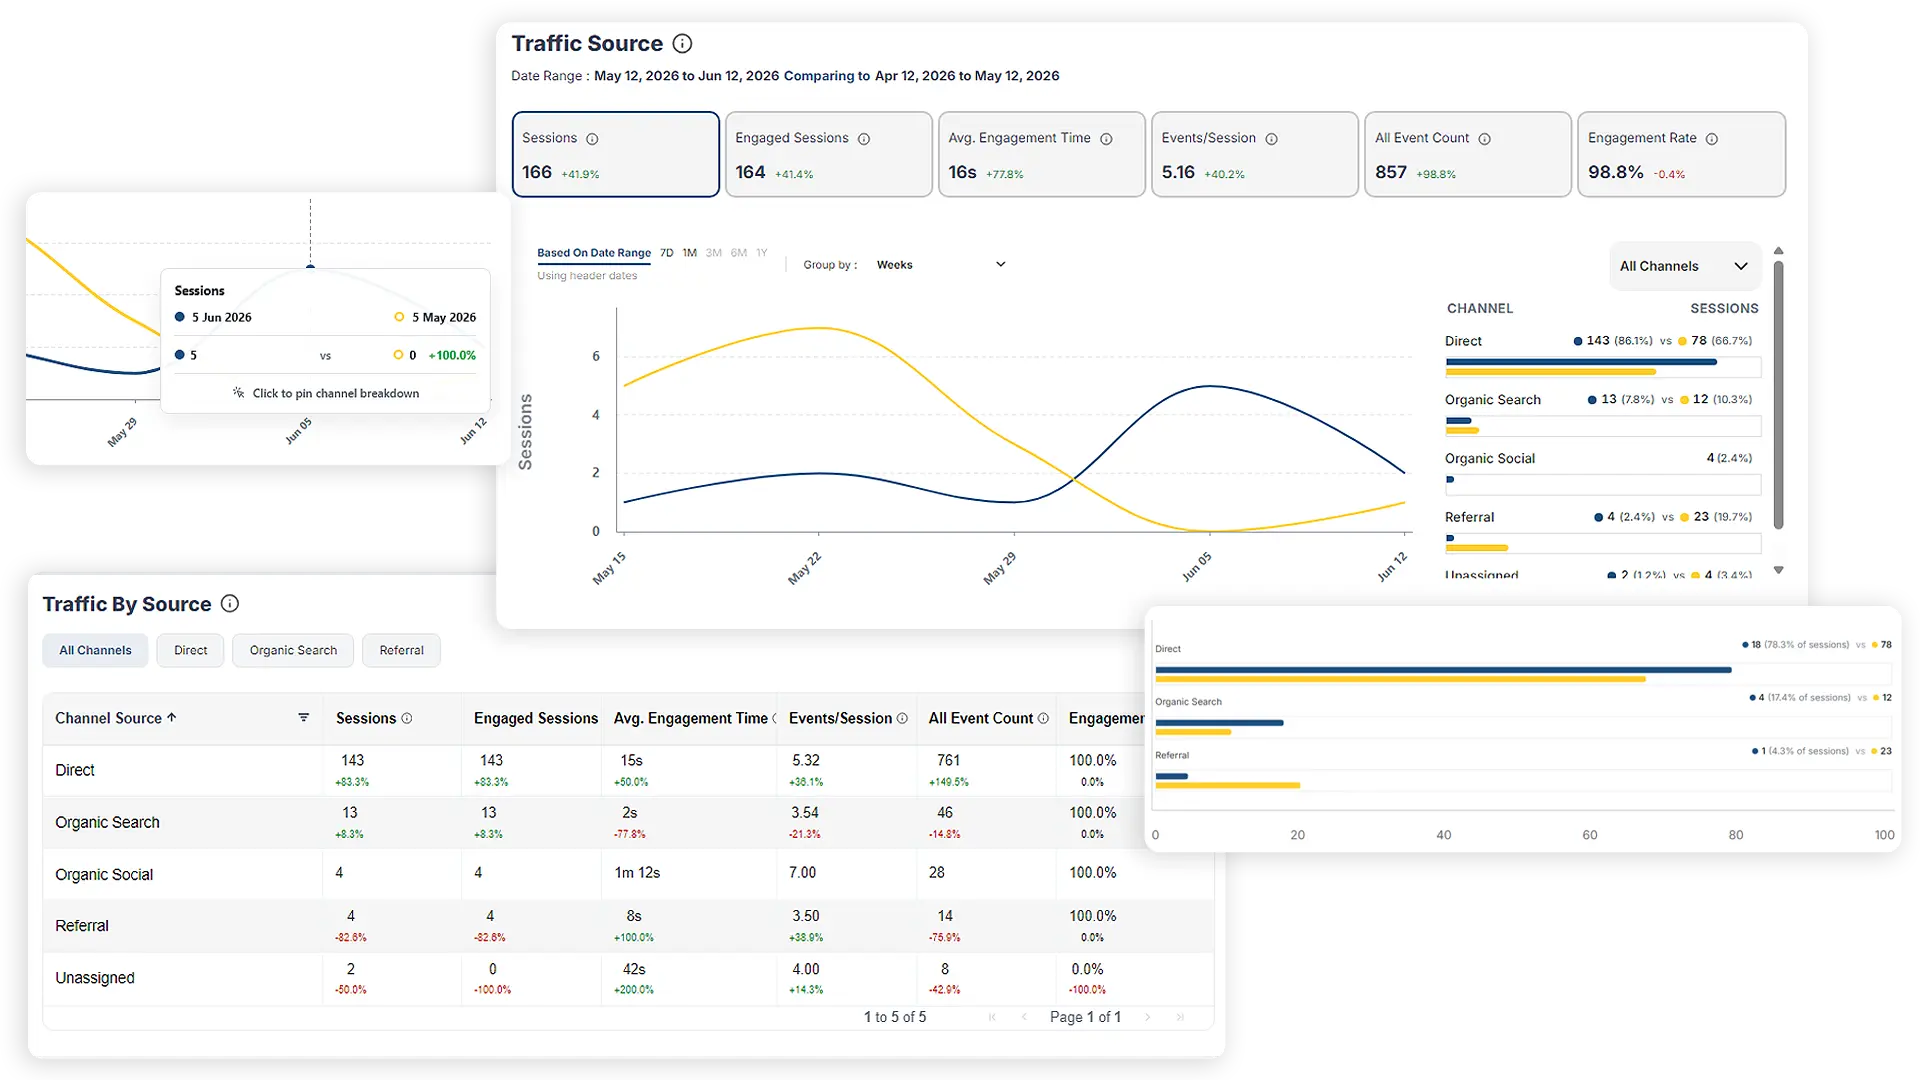
Which channel sends your best traffic, not just your most?
Organic might be your top channel by sessions. But if Paid drives twice the engagement rate and three times the conversions per session, you need to know that, not infer it from three separate reports.
Every channel is compared on the same six engagement metrics, simultaneously, in one view: Sessions, Engaged Sessions, Avg. Engagement Time, Events/Session, Event Count, and Engagement Rate, with growth deltas for any date range you choose.
Start Free Trial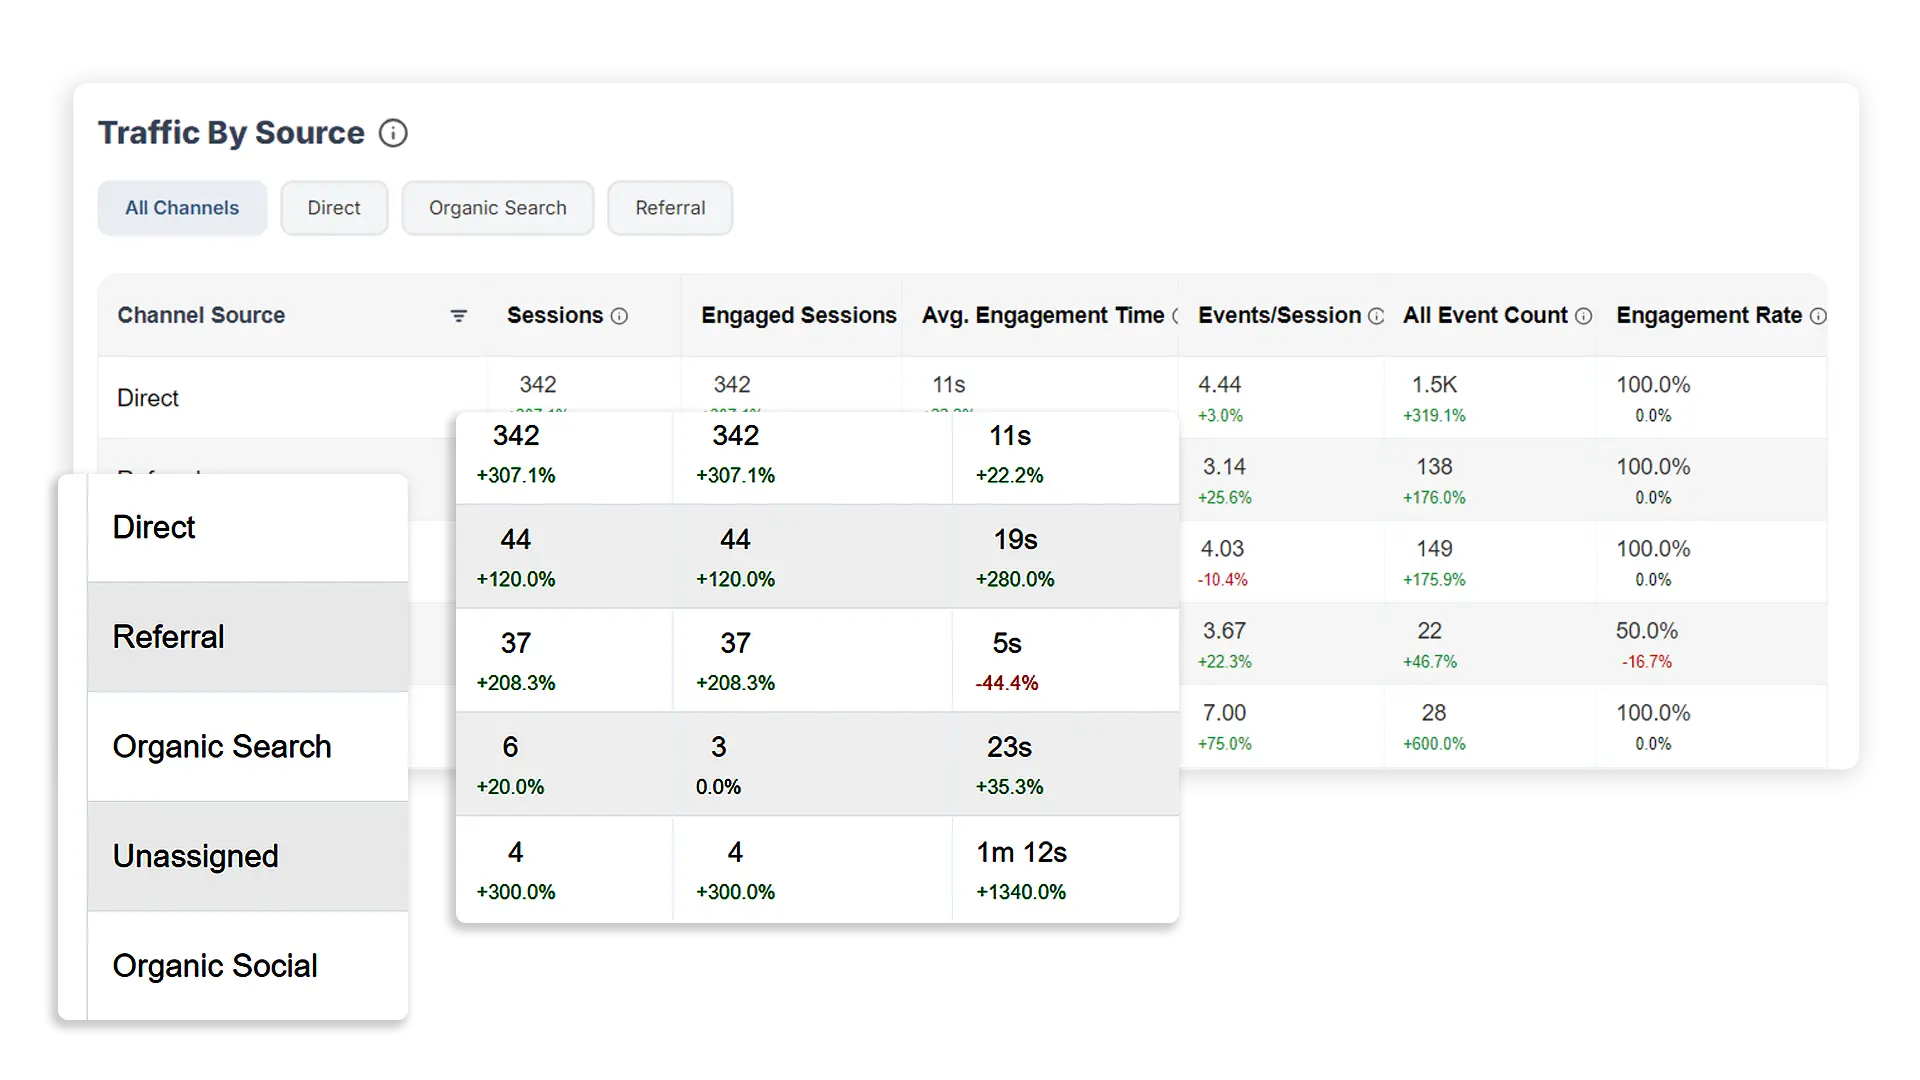
93 metrics Three you won't find in GA4's default reports
Most of the metrics here exist in GA4. What's different is how they're organised, by channel, by dimension, by page, by event, and what you can do with them side by side. Three of them go further: Bounce Rate and Exit Rate aren't in GA4's standard reports, and Search Visibility doesn't exist anywhere else.
Search Visibility
The estimated share of available search clicks your rankings capture, updated daily as a trend line alongside Clicks, Impressions, CTR, and Avg. Position. Does not exist in GA4 or GSC alone.
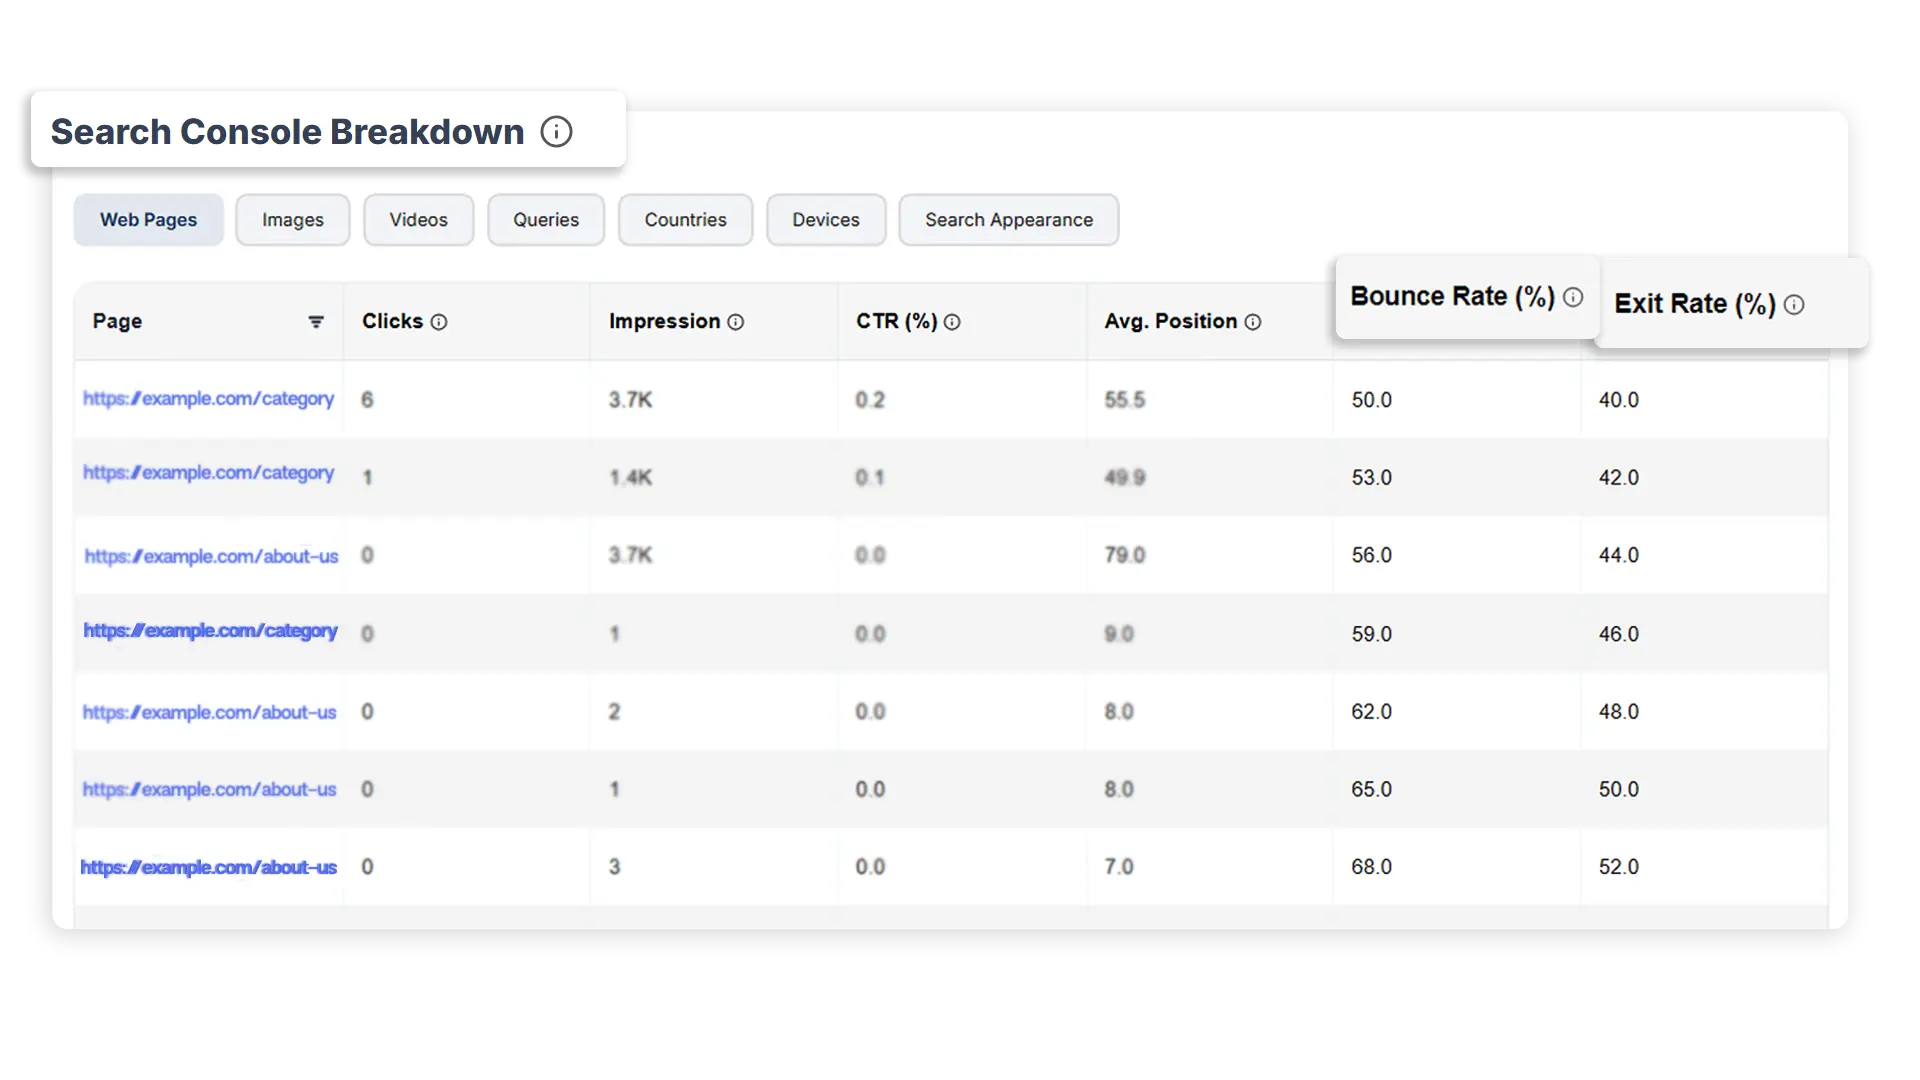
Bounce Rate (%)
The percentage of sessions that were not engaged, a metric not part of GA4's default reports. Present here per page, per country, per device, and per query, with period-over-period growth on every row.
Exit Rate (%)
The percentage of pageviews that were the last page in a session, essential for funnel analysis, and not part of GA4's standard reports. Here per URL, alongside every other page metric.
Audience 10 KPIs
Demographics 11 dimensions
Search Console 4 + 3 added
Pages & Content 5 per URL
Traffic Sources 7 channels
Events & Conversions 3
What changes when you can actually explain the numbers
I used to spend an hour every Monday pulling data from GA4 and GSC separately to answer one question from my manager. Now I open one tab and the answer is already there, including the channel breakdown that tells me exactly where sessions went.
Having Bounce Rate back is bigger than it sounds. Our entire reporting structure was built around it from our Universal Analytics days, and it isn't part of GA4's standard view. Seeing it per page with trend data made our weekly report make sense again.
The Search Visibility score is the first metric I check now. It's the one number that tells me whether our SEO work is actually expanding our reach, not just moving keywords around within the same pool of traffic.
Frequently asked questions
Do I need to connect both GA4 and Google Search Console?
You can connect either independently and the relevant dashboard sections will populate. Connecting both unlocks the full picture: GA4 provides the behavioural data (sessions, engagement, conversions) and GSC provides the search data (clicks, impressions, CTR, Avg. Position). The Search Visibility metric requires the Search Console connection.
How is this different from just using GA4 and GSC side by side?
Three ways. First, the data is unified in one view, so you're not switching tabs or cross-referencing manually. Second, the 11-dimension demographic breakdown combined with 7 engagement metrics per row goes substantially deeper than GA4's standard reports provide without custom Explore builds. Third, Bounce Rate and Exit Rate, not part of GA4's default reports, are included here, per page, per country, per device, and per query, with period-over-period comparison on every row.
What is Search Visibility and how is it calculated?
Search Visibility is a click-weighted score, not a raw traffic or search-volume number. For every keyword you rank for, we take its search volume and weight it by the click-through rate its position typically earns; a #1 ranking captures far more of the available clicks than a #15 ranking for the same keyword. Adding that up across your whole keyword set and expressing it as a percentage gives you one 0–100 score: how much of your total available search opportunity you're actually capturing, not just how many keywords happen to rank on page one. A site at 12.4% is capturing roughly 1 in 8 of the clicks available across its rankings. This score doesn't exist in GA4 or GSC alone; it requires ranking position and search volume combined.
Why do you include Bounce Rate and Exit Rate?
Many teams built years of reporting around Bounce Rate from their Universal Analytics days, and, as Google's own documentation confirms, it isn't part of GA4's default reporting view. We include it in the GSC Demographic Table per page, per country, per device, and per query, defined as the percentage of sessions that were not engaged, equivalent to the Universal Analytics metric you know.
How far back does the data go?
Date range is fully flexible: you can set any custom range your GA4 and GSC accounts hold data for. Period-over-period comparison lets you set any two date windows for side-by-side analysis. GroupBy controls (Days, Weeks, Months, Years) apply across all charts.
Can I export the data?
Yes. Each dashboard view can be exported as a PDF report in one click. The export captures the current view exactly as shown on screen, including the active date range, comparison period, and selected metrics. CSV and structured data exports are on the roadmap.
When is competitor tracking available?
The competitor intelligence module is built and being prepared for release. It will let you track up to 5 competitor domains and compare their Search Visibility, keyword rankings, Domain Authority, and Share of Voice alongside your own data. Join the waitlist below to be notified when it launches.
See your competitors' search visibility alongside your own
Competitor intelligence is the next layer. Track up to 5 competitor domains and see their estimated traffic, keyword rankings, Domain Authority, and Share of Voice on the same charts as your own data, so you're never guessing how you stack up.
- Share of Voice doughnut: who owns what percentage of search in your space
- Per-domain visibility trend lines on shared charts, so you spot the shift as it happens
- SERP position table with keyword-level rankings for you and up to 5 competitors side by side
- Domain Authority tracking: watch how your and each competitor's authority score moves over time
No spam. One email when it launches.
Stop guessing why your traffic moved Start knowing
Connect GA4 and Search Console in minutes. The answer to your Monday morning question is already waiting.
Start Free Trial 7-day free trial · No credit card required · Cancel anytime