Your Beautiful Website Is Killing Your Traffic

 Jun 15,2026
 By SEO ANALYSER
Introduction:
A slow website costs you customers before they ever see your content, and in 2026, Google’s ranking systems will make sure slow sites pay an additional penalty in search visibility.
A local clothing store in Brisbane launched a modern, well-designed website, but pages took over five seconds to load. Customers bounced, online orders dropped, and even in-store visits slowed as local search rankings deteriorated. Once the owners compressed images, streamlined code, and improved server response times, performance turned around quickly: rankings recovered, conversions grew, and customers stayed longer on the site.
This guide is for Australian business owners, marketers, and SEO practitioners who want to understand what speed metrics actually measure, why they matter for both rankings and revenue, and what practical steps produce the biggest improvements. You don’t need to be a developer to act on this, but you do need to understand what’s going wrong.
What Are Speed Metrics in SEO?
Speed metrics are the measurable signals Google and other search engines use to assess how quickly and smoothly your website loads for real users, and they directly influence both rankings and user behaviour.
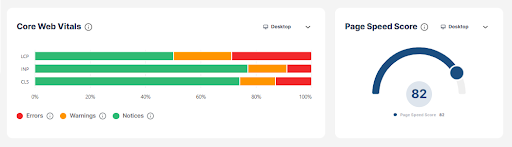
Google’s primary speed framework is Core Web Vitals, a set of metrics that evaluate distinct aspects of the user experience during page load. As of 2026, the three Core Web Vitals are:
- Largest Contentful Paint (LCP): How quickly the largest visible element on the page, typically a hero image, heading, or video thumbnail, fully loads. This is what users perceive as “the page has loaded.”
- Interaction to Next Paint (INP): How responsive the page is to user interactions across the entire session, clicking buttons, filling forms, and navigating menus. INP replaced First Input Delay (FID) in March 2024 and is a more comprehensive measure of interactivity [Google Search Central, 2024].
- Cumulative Layout Shift (CLS): How visually stable your page is while loading. A high CLS score means elements are jumping around as the page renders, a common frustration on mobile.
Beyond Core Web Vitals, these supporting metrics are worth monitoring:
- Time to First Byte (TTFB): How quickly your server begins responding to a request, a foundational indicator of hosting and server health
- First Contentful Paint (FCP): When the first visual element appears on screen, signalling to the user that something is happening
- Total blocking time (TBT): How long the main thread is blocked from responding to user input during load
Pro tip: Don’t confuse LCP with total page load time. A page can have a good LCP score (the main content loads fast) but still have elements loading in the background that affect CLS and INP. You need to assess all three metrics together.
For Example:
A café homepage whose text renders instantly but whose hero banner image takes six seconds to load will score poorly on LCP, even if the rest of the page feels fine. Google measures the slowest major element, not the average.
Why Speed Metrics Matter for Local Australian Businesses
For local businesses, a slow website is often the difference between winning a customer and losing them to the competitor listed directly below you in search results.
Research consistently shows that more than half of mobile users will abandon a site that takes longer than three seconds to load [Google/Deloitte Mobile Speed Study, 2019, still widely cited as the foundational benchmark]. For local searches, “dentist near me,” “café in Adelaide,” “emergency plumber Brisbane”, users have immediate intent and zero patience for sluggish sites. If your site lags, they’ll tap the next result before your page even finishes loading.
Speed also influences trust. Australian consumers associate a smooth digital experience with professional, reliable service. A slow or unstable site signals the opposite, regardless of how good your actual product or service is.
Pro tip: Test your site on a mid-range Android device using a 4G connection, not your office Wi-Fi. This simulates the experience of the majority of your local mobile customers, and the results are often sobering.
For Example:
A local plumber with a two-second load time may consistently win mobile enquiries, while a competitor with a five-second site loses leads to the faster result, even if the slower site has better reviews and more detailed content.
What Tools Measure Speed Metrics Effectively?
No single tool gives you the complete picture; use at least two in combination for reliable speed diagnostics.
Google PageSpeed Insights
Free and directly aligned with how Google measures your site. PageSpeed Insights combines real-world data from the Chrome User Experience Report (CrUX) with lab-based diagnostics. The field data (real users) is what actually influences your Core Web Vitals assessment in Google Search Console.
Lighthouse (Chrome DevTools)
Built into Chrome’s developer tools and available as a standalone audit. Lighthouse runs a detailed lab test covering performance, accessibility, SEO, and best practices. It provides specific, actionable recommendations, identifying render-blocking scripts, oversized images, and unused CSS with precise file-level detail.
Pro tip: Run Lighthouse in an incognito window to prevent browser extensions from affecting your scores.
GTmetrix
Generates waterfall charts that show the loading sequence of every resource on your page, images, scripts, fonts, and third-party embeds. This makes it easy to identify exactly which requests are causing delays and in what order. GTmetrix also supports scheduled monitoring with alerts for performance regressions.
WebPageTest
Allows you to test from specific locations (including Sydney and Melbourne), on specific devices, and at specific connection speeds. Particularly useful for simulating the experience of regional Australian users on mobile data.
How Does Site Speed Influence SEO Rankings?
Site speed affects your Google rankings through two distinct mechanisms: direct ranking signals and indirect user behaviour signals.
Directly, Google uses Core Web Vitals as a confirmed ranking factor within its page experience signals. Pages that meet the “Good” thresholds for LCP, INP, and CLS receive a positive ranking adjustment over pages that don’t, all else being equal [Google Search Central, 2021, updated 2024].
Indirectly, fast sites reduce bounce rates and increase dwell time. When users stay on your pages longer and engage more deeply, Google interprets that as evidence of a quality result, reinforcing your rankings over time.
Speed also affects crawl efficiency. As covered in our [Crawling & Indexing SEO guide], Googlebot adjusts its crawl rate to your server’s response speed. A faster server means more pages are crawled per day, critical for large e-commerce or content-heavy sites where slow crawling can leave new pages undiscovered for weeks.
Google’s mobile-first indexing means your mobile site’s speed determines your rankings across all devices, not just mobile searches. If your mobile experience is slow, your desktop rankings suffer too.
What Causes Poor Speed Metrics?
Most site speed problems fall into a small number of recurring categories, and many are straightforward to address once identified.
- Oversized, uncompressed images: The single most common culprit on Australian small business sites. A product photo served at 4MB, where a 120KB WebP would look identical, adds seconds to LCP on mobile connections.
- Render-blocking CSS and JavaScript: Scripts loaded in the <head> that must fully execute before the page can display anything, even if those scripts aren’t needed for the initial view.
- Slow server or shared hosting: Entry-level shared hosting often produces TTFB above 1 second, which cascades into poor LCP and FCP scores across the entire site
- Excessive plugins or bloated themes: A WordPress site with 40+ active plugins may add multiple seconds of processing time per page load, as each plugin adds database queries and script execution
- Poor caching configuration: Without browser and server-side caching, returning visitors experience the same full load time as first-time visitors
- Third-party scripts: Analytics tags, chat widgets, social embeds, and advertising pixels each add external requests that can significantly delay INP and total load time.
- Redirect chains: URLs that bounce through two or three redirects before reaching the final destination add unnecessary latency on every request
Common mistake: Fixing one or two issues and re-testing without addressing the full list. Speed is cumulative; a 0.3-second improvement here and 0.4 seconds there adds up to a meaningfully faster site.
How to Improve Site Speed Without Sacrificing Design
Optimising for speed does not mean stripping back your design; it means delivering that design more efficiently to the browser.
Image Optimisation
What to do: Convert all images to WebP format, compress to the smallest file size that maintains acceptable visual quality, and serve images at the correct display dimensions (not larger).
Why it matters: Images typically account for 50–70% of a page’s total byte weight. This is almost always the highest-impact, lowest-risk optimisation available.
Pro tip: Use Squoosh (free, browser-based) or ShortPixel (WordPress plugin) for bulk image compression. Aim for images under 150KB for most use cases.
Lazy Loading
What to do: Add loading=”lazy” to images and iframes below the fold so they only load when a user scrolls near them.
Why it matters: This reduces the initial page weight significantly, improving both LCP (fewer resources competing for bandwidth during load) and perceived performance.
Caching and Content Delivery Networks (CDNs)
What to do: Configure browser caching headers so returning visitors load static assets from their local cache. Add a CDN (such as Cloudflare, which has a free tier) to serve assets from servers geographically close to your Australian users.
Why it matters: A CDN can reduce TTFB by 30–60% for users in regional areas by serving content from a Sydney or Melbourne edge node rather than a distant origin server.
Minification and Script Management
What to do: Minify CSS, JavaScript, and HTML to remove whitespace and comments. Move non-critical JavaScript to load after the main content (defer or async attributes), and remove unused CSS.
Why it matters: Render-blocking scripts prevent your page from displaying anything until they finish executing. Deferring them allows your LCP element to load first.
Hosting Upgrade
What to do: If your TTFB consistently exceeds 800ms, consider moving from shared hosting to cloud or managed hosting (such as Kinsta, WP Engine, or a VPS on DigitalOcean or AWS Sydney region).
Why it matters: No amount of front-end optimisation can compensate for a slow server. TTFB is the foundation everything else builds on.
Pro tip: Before committing to a hosting upgrade, run WebPageTest from a Sydney test location and check your TTFB in isolation. If it’s under 400ms, your server likely isn’t the primary bottleneck.
FAQ
What are Core Web Vitals and why do they matter?
Core Web Vitals are Google’s three primary page experience metrics: LCP (how fast the main content loads), INP (how responsive the page is to interactions), and CLS (how visually stable the page is during load). They are a confirmed Google ranking factor and directly reflect the experience real users have on your site.
How fast should my website load in 2026?
Aim for LCP under 2.5 seconds, INP under 200ms, and CLS under 0.1 to meet Google’s “Good” thresholds. For overall load time, under 3 seconds on mobile and under 2 seconds on desktop are widely accepted industry targets.
Will improving page speed always improve my rankings?
It improves your rankings indirectly in most cases, through better Core Web Vitals scores, lower bounce rates, and more efficient crawling. For highly competitive keywords, speed alone won’t overcome large authority gaps, but it removes a barrier that could otherwise be costing you positions.
Can visually rich, design-heavy websites still be fast?
Absolutely. With WebP image formats, lazy loading, a CDN, and deferred JavaScript, a visually rich site can meet all Core Web Vitals thresholds. Design quality and performance are not in conflict; poor implementation is the problem, not design ambition.
How often should I test my site speed?
Check Google Search Console’s Core Web Vitals report monthly. Run a detailed PageSpeed Insights or Lighthouse audit any time you make significant changes to your site, new themes, plugins, templates, or major content updates.
Suammry
A slow website costs you customers before they even see your content. In 2026, Google uses Core Web Vitals, LCP, INP, and CLS, to measure how fast and stable your pages are. These metrics are a confirmed ranking factor. If your site fails them, you pay a penalty in search visibility.
For local Australian businesses, speed is especially critical. More than half of mobile users abandon a site that takes longer than three seconds to load. Local searches like “café in Adelaide” or “plumber near me” come from users with immediate intent. If your site lags, they tap the next result, and that’s a customer lost.
The most common causes of slow sites are oversized images, render-blocking scripts, cheap shared hosting, and too many plugins. The good news is that most of these are straightforward to fix. Converting images to WebP, enabling a CDN like Cloudflare, and deferring non-critical JavaScript can dramatically improve your scores, without changing your design.
Speed optimisation is not a one-time task. New plugins, embedded widgets, or large image uploads can silently degrade performance overnight. Use Google Search Console to monitor Core Web Vitals monthly, and run a full Lighthouse audit any time you make significant changes to your site.